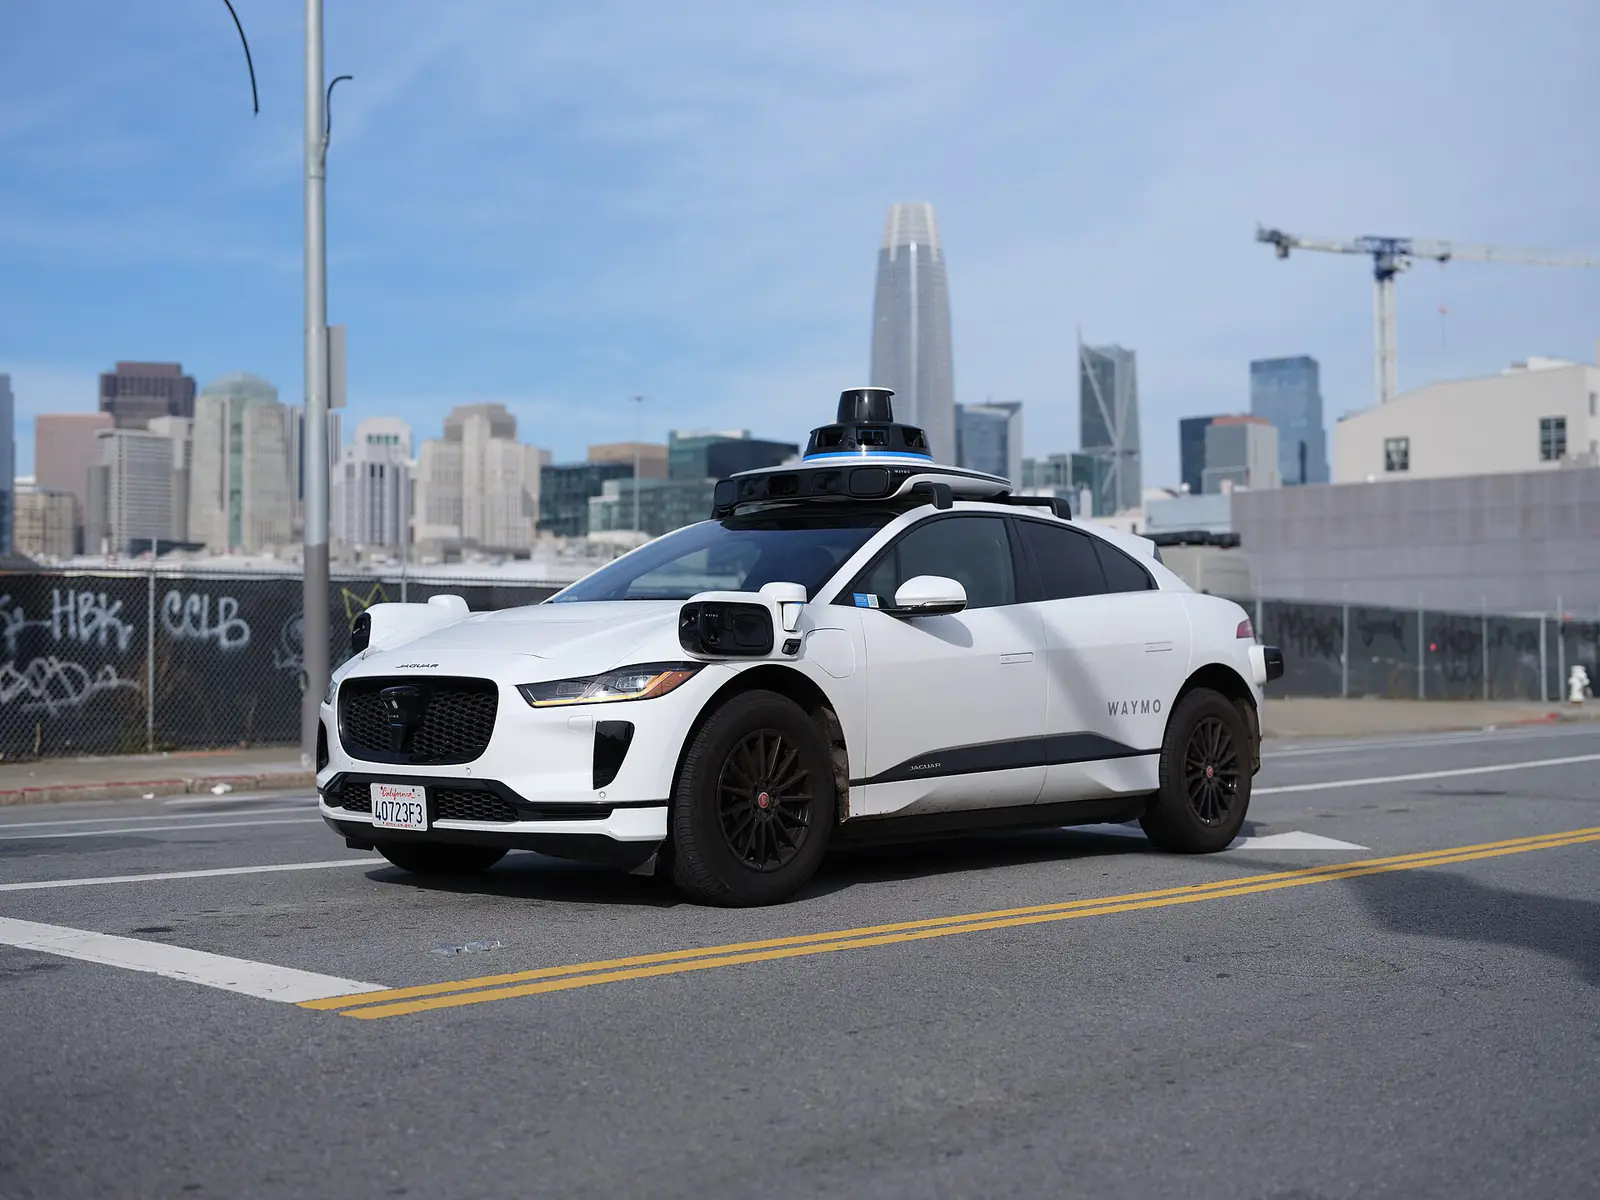
When a robotaxi company says its cars cause far fewer injuries than human drivers, the claim rests on a chain of choices: which miles count, which crashes count, and which humans form the baseline. Waymo’s public figures show how the method works. Through June 2026 the company reports 271.3 million rider-only miles and, compared with a human benchmark, 95% fewer crashes with serious injuries or worse. Reading numbers like these well means knowing where they come from and what they cannot prove.
Start with exposure: rider-only miles
Safety is a rate, so the first ingredient is exposure, the distance driven. Waymo reports “rider-only” (RO) miles, driven with no human at the wheel. Its safety hub says it logged 271.3 million of them through June 2026, split across Phoenix, the San Francisco Bay Area, Los Angeles, Austin, Atlanta and other cities. In its October 20 announcement about Madrid, the company cites more than 400 million fully autonomous kilometers, a figure of similar scale expressed in metric units.
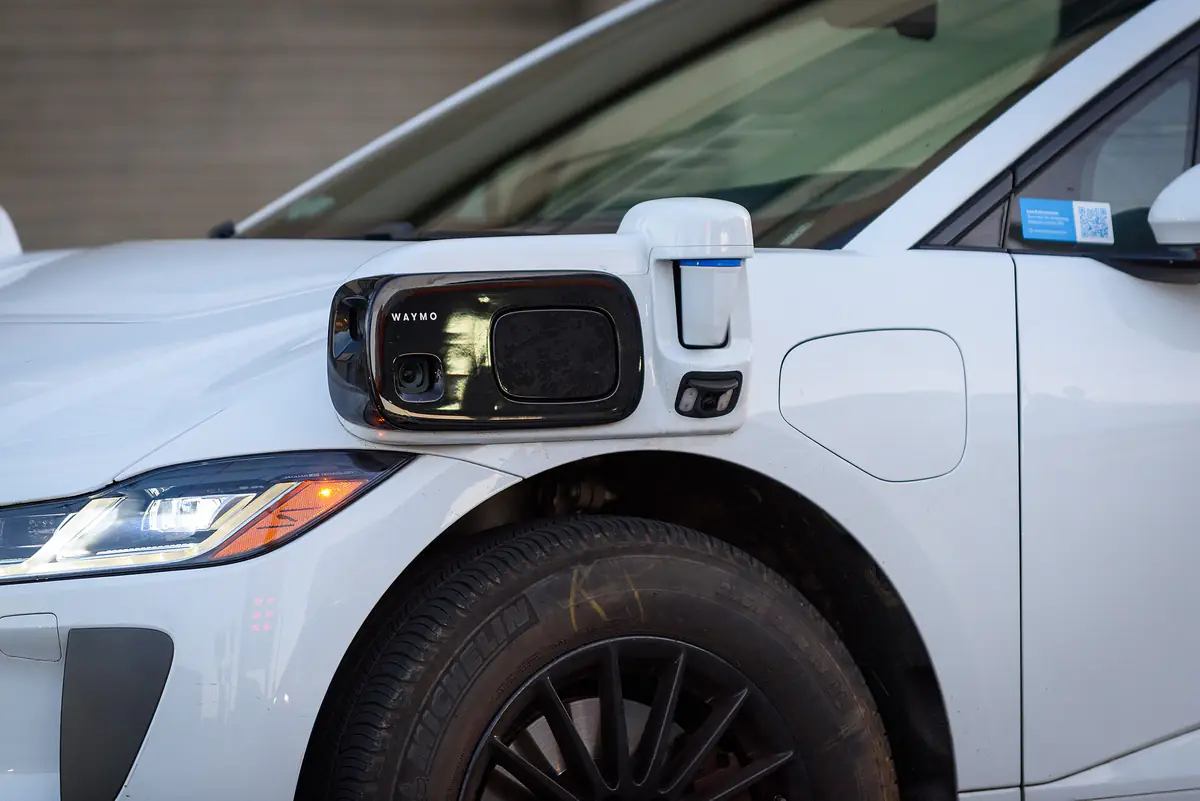
Why only rider-only miles? Testing with a safety driver is a different system, because a person can intervene. Counting supervised miles would blur what the software alone can do. Rider-only miles also come from specific places, mostly mapped city streets in good-weather regions, so the resulting rates describe those conditions, not driving everywhere.
Then the events: crash reporting
The second ingredient is a count of crashes. In the United States, the National Highway Traffic Safety Administration’s Standing General Order requires manufacturers and operators to report crashes involving automated driving systems and certain driver-assistance systems. Waymo says its hub is refreshed in step with the SGO reporting timelines. The reports cover collisions regardless of who was at fault, which is a strict standard: a Waymo vehicle that is rear-ended while stopped still counts.
Crashes are grouped by severity: any-injury crashes, airbag-deployment crashes and “serious injury or worse” crashes. Severe events are rare, so the severe-crash count is small. The hub’s own comparison table shows 55 fewer serious-injury-or-worse crashes than the benchmark predicts for the same distance, against 841 fewer injury-causing crashes. A smaller count means wider uncertainty, which is why the hub plots 95% confidence intervals around its rates.
The human benchmark is the hard part
A rate means little without something to compare it with. Waymo builds benchmarks from human crash data for surface streets in the cities where it operates, then asks how many crashes a human driver at the average rate would have had over the same distance. On that basis it reports:
- 95% fewer serious-injury-or-worse crashes
- 82% fewer airbag-deployment crashes
- 82% fewer injury-causing crashes
- 93% fewer pedestrian crashes with injuries, 86% fewer cyclist and 82% fewer motorcycle
These are company-calculated figures and the headline is not peer-reviewed in the hub itself, though the company says its method builds on dozens of its publications. Several issues complicate a benchmark. Human crashes are under-reported, especially minor ones. Averages mix drunk, tired and distracted drivers with careful ones, so the comparison may flatter an automated system, or a sober-driver comparison may be tougher. Waymo itself published a post on October 8 about sober-driver nighttime risk, which shows how much the choice of baseline can change a result. Road type, time of day and weather also shift risk, and a benchmark must match them.
How many miles prove safety?
A classic RAND Corporation study, “Driving to Safety,” examined how much driving is needed to show statistically that an automated system is as safe as people in fatalities. Its answer was striking: for something as rare as a fatal crash, it takes hundreds of millions to billions of miles, and more still to show a modest improvement over humans. The lesson is that fatality statistics alone are slow to converge. That is why companies lean on injuries and other more frequent outcomes, and why independent researchers look at leading indicators such as near-misses and simulation.
Beyond rates: the safety case
Crash rates are retrospective. Waymo notes that the hub is “retrospective validation,” while its readiness before deployment is judged through a documented Safety Case, a structured argument backed by evidence that a system is acceptably safe in a defined operating domain. Safety cases combine simulation, closed-track tests, public-road driving, hazard analysis and monitoring after launch. They draw on standards for functional safety and for risks that arise when software behaves as designed but still misjudges a scene.
Preparedness for rare events is another layer. In October, Waymo researchers published a framework adapting FEMA’s Homeland Security Exercise and Evaluation Program to automated vehicles, with formative, educational, summative and confirmatory exercises, so fleets, first responders and agencies can rehearse emergencies before they occur.
How to read a safety claim
- Check the comparison. Which humans, which roads, which severity of crash?
- Look at the interval. Rare events give wide error bars.
- Note the domain. Results from sunny, mapped cities do not transfer automatically to snow or unmapped roads.
- Ask who verified it. Company dashboards are useful but independent analyses add confidence.
For background on the technology behind these systems, see our guide to how self-driving cars see, our explainer on the SAE levels of automation and our analysis of why robotaxis are hard to scale.
What to watch next
- New SGO crash data and updates to Waymo’s rider-only mileage for the period after June 2026.
- Independent academic or insurer analyses that test company benchmarks.
- Results from Waymo’s planned entry into Madrid, where the company says it will begin with manual driving and validation before carrying riders in 2027.
- Any regulator moves on standardizing how AV safety must be reported.
Key takeaways
- Autonomous-vehicle safety claims are rates: events divided by miles, compared with a human baseline.
- Waymo reports 271.3 million rider-only miles through June 2026 and 95% fewer serious-injury-or-worse crashes than its benchmark.
- Rare outcomes give wide uncertainty, so confidence intervals and injury-level crashes matter.
- Benchmarks, operating domains and company authorship are the main caveats.
- Safety cases and emergency exercises cover what crash statistics cannot.
Frequently asked questions
How is robotaxi safety measured?
Mostly as crashes per million miles, grouped by severity, and compared with a human crash rate for the same type of roads. Companies also use safety cases, simulation and testing.
What are rider-only miles?
They are miles driven with no human driver, carrying passengers or operating in service. Waymo reports 271.3 million of them through June 2026.
Can we trust company safety figures?
They are useful but self-published. Look for confidence intervals, a clear benchmark method, regulatory crash reports and independent analysis.